

IELTS Task 1 table questions require you to describe figures, identify key features, and make relevant comparisons. Tables may present information about countries, age groups, years, products, or other categories. The main challenge is not describing every number but selecting the most important information and organising it clearly. Table questions are an important part of the IELTS Academic Task 1 test. They require candidates to report and compare information presented in a table. Candidates should identify the main features and organise the figures clearly.
How to Understand IELTS Table Questions
Before writing, spend a few minutes studying the table. Check the title, categories, units, and time periods carefully. This helps you understand what the figures represent.
Look for the highest and lowest values first. Then check whether some figures are similar or significantly different. If the table covers different years, look for increases, decreases, and changes over time.
You do not need to mention every figure. Select the numbers that help explain the main features of the table.
IELTS Table Questions: Horizontal or Vertical Approach
When describing an IELTS Task 1 table, there are two useful ways to organise the information: horizontal and vertical. The best approach depends on the categories and figures given in the table.
Horizontal Approach
In a horizontal approach, you read across each row and compare the figures within that category. This method works well when each row represents a particular group, country, product, or other category.
Vertical Approach
In a vertical approach, you read down each column and compare different categories in the same year or period. This is useful when the table contains several groups that can be compared with one another.
Which Approach Should You Use?
There is no fixed rule that says every table must be described horizontally or vertically. Choose the method that allows you to make the clearest comparisons.
You can also combine both approaches if the table contains different types of information. For example, one body paragraph can compare figures across years, while the next paragraph can compare categories within a particular year.
The key is to avoid simply describing the table from left to right. Select the most important information and group related figures together. This makes the report more organised and helps you produce a clear overview.
IELTS Table Questions: Useful Vocabulary
For more useful words and phrases, learn more about PTE Describe Image Vocabulary Words to improve your fluency and describe charts more confidently.
For the highest percentage:
- highest proportion
- largest share
- biggest percentage
- dominant category
- major proportion
- largest segment
- accounts for the highest percentage
For the lowest percentage:
- lowest proportion
- smallest share
- smallest percentage
- minor proportion
- least significant category
- smallest segment
- accounts for the lowest percentage
For comparisons:
- higher than
- lower than
- greater than
- less than
- compared with
- in comparison with
- whereas
- while
- followed by
- respectively
For describing similarities:
- similar proportion
- almost the same
- relatively similar
- comparable share
- equal proportion
- approximately the same
For describing differences:
- significant difference
- considerable difference
- noticeable difference
- slight difference
- substantial gap
- major variation
IELTS Task 1 Table Question: Universal Report Writing Template
Introduction
The table shows [what is being compared] in [place/time], with figures given in [units].
Overview
Overall, [main feature] was the highest figure, while [lowest feature] had the smallest figure. Another noticeable point is that [main comparison or change].
Body Paragraph 1
Looking at the first group, [item 1] recorded [number], while [item 2] stood at [number]. [Item 3] was slightly higher/lower, at [number]. The figures for [item 4] and [item 5] were [numbers], respectively.
Body Paragraph 2
Turning to the remaining figures, [item 1] had [number], compared with [number] for [item 2]. Meanwhile, [item 3] recorded [number]. The difference between these figures was [small/considerable/significant].
Question 1:
You should spend about 20 minutes on this task. Write at least 150 words
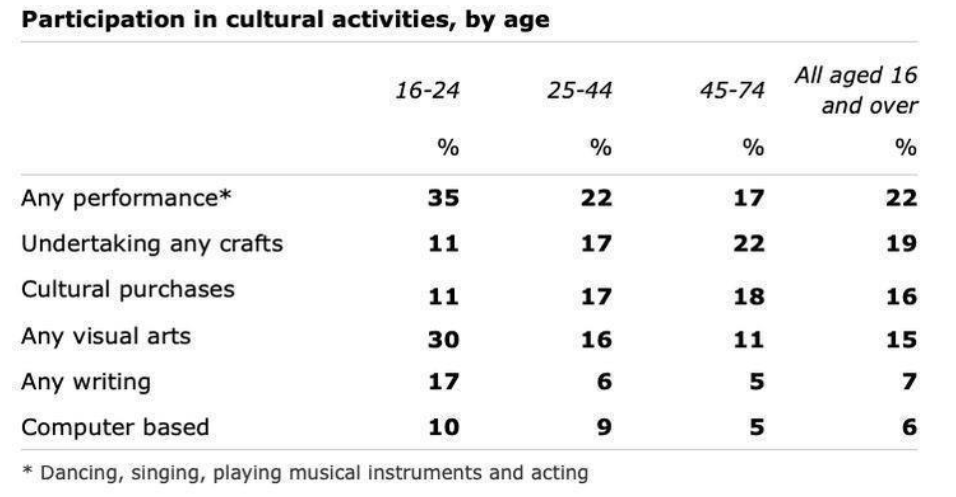
The table below shows the results of a survey that asked 6800 Scottish adults (aged 16 years and over) whether they had taken part in different cultural activities in the past 12 months.
Summaries the information by selecting and reporting the main features and make comparisons where
relevant.
Write at least 150 words.
Sample Answer (Horizontal Explanation)
The table shows the percentages of Scottish adults aged 16 and over who participated in different cultural activities during the previous 12 months.
Overall, any performance was the most common activity among 16–24-year-olds, while undertaking crafts was more popular among the oldest group. Younger adults also had higher participation in visual arts and writing.
Looking first at any performance, the figure was 35% for people aged 16–24. It then fell to 22% among those aged 25–44 and 17% for the 45–74 group, 22% for all aged 16 and over. By contrast, participation in crafts increased with age, rising from 11% to 17%, compared with 19% among all adults aged 16 and over.
Turning to cultural purchases, the figures increased from 11% among the youngest group to 17% and 18%, while age 16 and over with 16% participation. Visual arts showed the opposite pattern, declining from 30% to 16% and 11%, compared with 15% among all adults aged 16 and over. Similarly, participation in writing dropped from 17% to 6% and 5%. Finally, computer-based activities accounted for 10%, 9%, 5% and 6%, respectively.
Sample Answer (Vertical Explanation)
The table illustrates the percentages of people in three age groups who participated in six different cultural activities, together with the overall figure for those aged 16 and above.
Overall, younger people were more involved in performances, visual arts, writing, and computer-based activities, whereas older adults showed greater participation in crafts and cultural purchases.
Among those aged 16–24, 35% took part in performances, making it the most popular activity in this group. This was followed by any visual arts at 30%, while computer-based activities were the least common at 10%. In the 25–44 age group, participation in performances declined to 22%, while both crafts and cultural purchases stood at 17%. The least popular activity was any writing at 6%.
In contrast, people aged 45–74 were most interested in crafts at 22%, followed by cultural purchases at 18% and performances at 17%. Any writing and computer-based activities recorded the lowest participation at 5% respectively. Overall, performances had the highest participation rate at 22%, whereas computer-based activities were the least popular at 6% among those aged 16 and over.
Question 2:
You should spend about 20 minutes on this task. Write at least 150 words
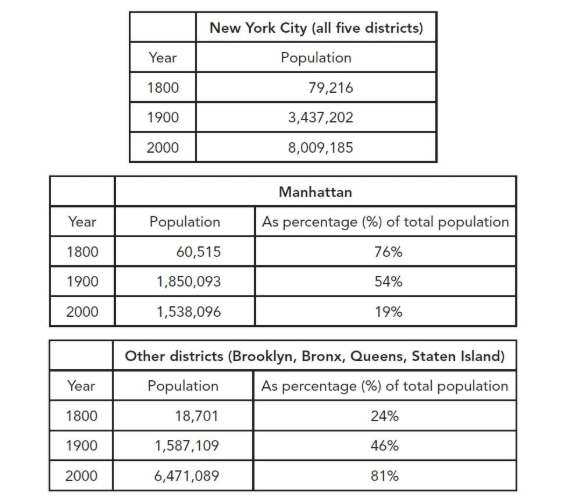
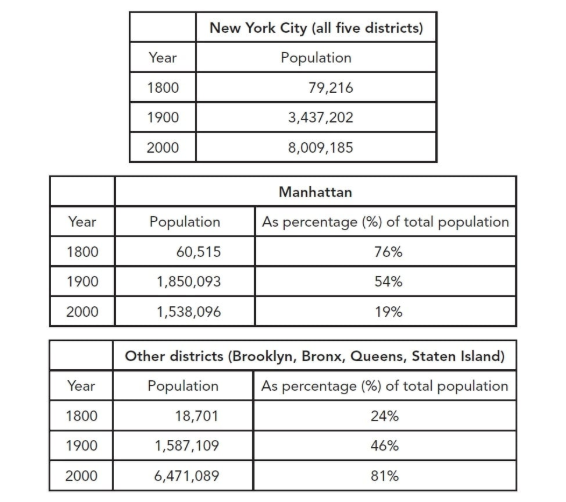
The first table below shows changes in the total population of New York City from 1800 to 2000. The second and third tables show changes in the population of the five districts of the city (Manhattan, Brooklyn, Bronx, Queens, Staten Island) over the same period.
Summarise the information by selecting and reporting the main features, and make comparisons where relevant.
Write at least 150 words. IELTS20 Academic 2025
Sample Answer
The tables show changes in the population of New York City and its five districts—Manhattan, Brooklyn, the Bronx, Queens, and Staten Island—from 1800 to 2000.
Overall, New York City’s population increased dramatically over the two centuries. While Manhattan’s population declined after 1900, the other districts experienced substantial growth, both in population and their share of the city’s total.
In 1800, New York City had 79,216 residents. This figure rose to 3,437,202 in 1900 and further to 8,009,185 in 2000.
Manhattan had 60,515 residents in 1800, accounting for 76% of the total. By 1900, its population had soared to 1,850,093, although its share fell to 54%. By 2000, its population had declined to 1,538,096, representing only 19%.
The other districts had 18,701 people in 1800, or 24% of the total. Their population increased to 1,587,109 in 1900, representing 46%, before soaring to 6,471,089 in 2000, or 81% of the city’s population.