

Mastering essential PTE Describe Image vocabulary is critical for achieving a high score in the PTE Speaking test. Because this task requires you to speak fluently under strict time limits, knowing the right graph words, trend verbs, and structural phrases makes all the difference. This comprehensive guide covers everything you need to describe graphs, charts, tables, and maps with absolute confidence.
PTE Describe Image Vocabulary for Fluctuations
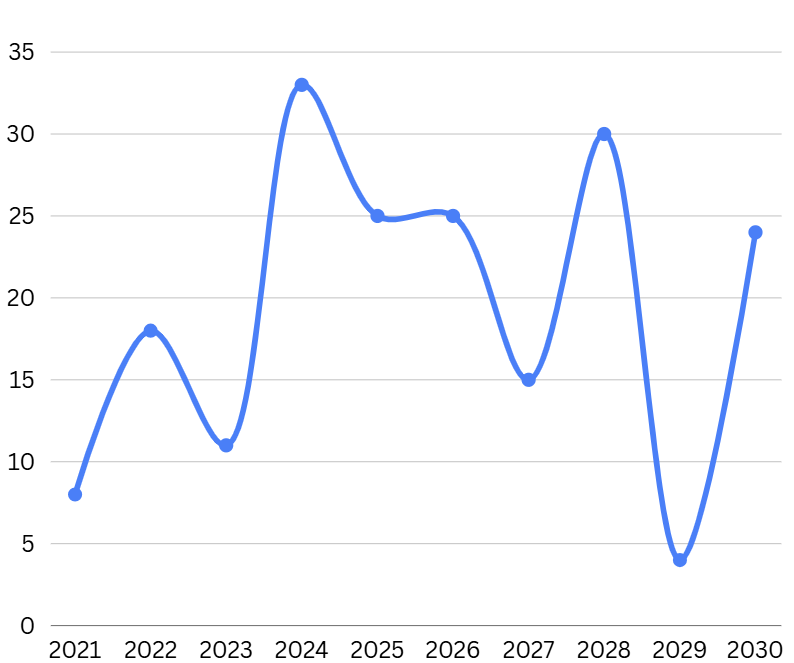
Vocabulary for Fluctuation
Useful words = Variation, Changes, Oscillation, Rise and Fall, Ups and Downs, Volatility, Irregular
Sentence Examples
The figure experienced minor fluctuations.
The price remained volatile, with several sharp changes.
2. Vocabulary for Overtaking and Surpassing

Vocabulary for Overtaking and Surpassing
Useful Words = Overtook, Surpassed, Exceeded, Outweigh, Became higher than, Crossed
Sentence Examples
In 2025, A overtook B
The figure of cars surpassed the figure of buses in 2018.
3. PTE Describe Image Vocabulary for Increase
Use these words when a figure moves upward.
- rise (present) rose (past) will rise (future),
- climb – climbed
- incline – inclined
- upward
- growth, improve,
- leap, soar.
Sentence Examples
The figure rose from 20 to 50.
The number climbed gradually.
4. PTE Describe Image Vocabulary for Decrease
- fall – fall (present), fell (past), will fall (future)
- decline – declined
- drop – dropped
- dip – dipped
- decrease, diminish
- slumped, plunged
- collapse, downward trend.
Sentence Examples
The percentage dipped from 90 to 45.
The ratio of solar power consumption dropped slightly.
5. Vocabulary for Highest Figures
- largest
- maximum
- dominant
- peak
- biggest
- greatest
- majority
- predominant
Examples
The highest figure was recorded in 2023.
The figure reached a peak of 75 in 2025.
6. Vocabulary for Lowest Figures
- smallest
- least
- bottom/ bottommost
- base
- minimum
- lowest
- minor/ minority
Sentence Examples
The lowest figure was recorded in 2023.
The smallest figure was recorded in 2021.
7. Vocabulary for No Change
- constant
- stable
- rigid
- unchanged
- remain at the same level
- stability
- remained consistent
- Level off
8. Language of Approximation for PTE Describe Image
- around
- roughly
- nearly
- approximately
- just over/ just under
- about
- almost
- close to
9. Adjectives and Adverbs of Big Changes
| Adjectives | Adverbs |
| sharp | sharply |
| dramatic | dramatically |
| enormous | enormously |
| rapid | rapidly |
| significant | significantly |
10. Adjectives and Adverbs of Small Changes
| Adjectives | Adverbs |
| slight | slightly |
| marginal | marginally |
| gradual | gradually |
| slow | slowly |
| modest | modestly |
11. Time Expressions for PTE Describe Image
- From 2010 to 2015
- Between 2010 and 2015
- Over the decade.
- For the next three years,
- In the final year
- By 2020
- Until 2018
- Since 2015
12. Vocabulary for Describing Bar Graphs
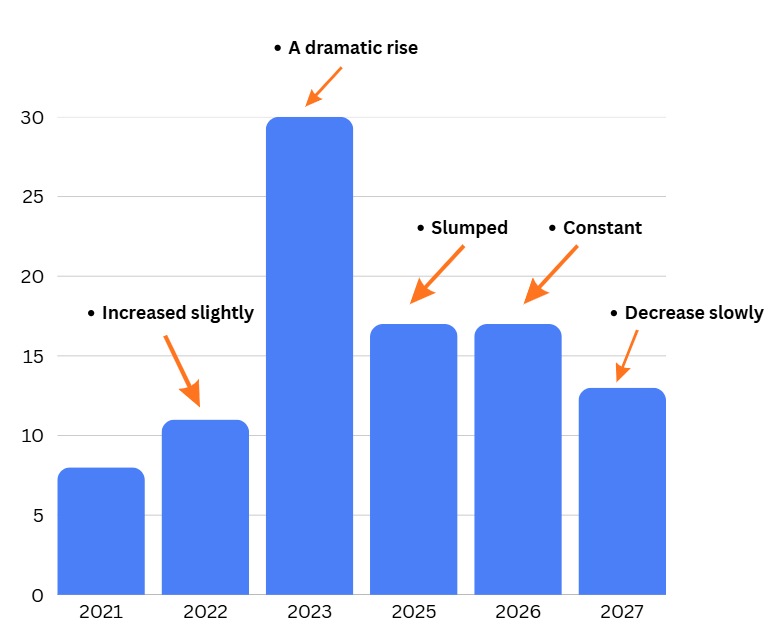
Describing each change with the year and figure:
In 2021, the figure stood at approximately 8.
In 2022, it increased slightly to around 11.
In 2023, there was a dramatic rise, reaching 30.
In 2025, the figure slumped to approximately 17.
In 2026, it remained constant at around 17.
In 2027, the figure decreased slowly to about 13.
If you want to focus specifically on bar graph data, you can learn more about how to describe a bar chart using precise numbers and comparisons.
13. Fractions and Proportions Vocabulary
Fractions
- One-third (⅓) = approximately 33%
One-third of the students preferred online learning.
- One-fourth (¼) = 25%
One-fourth of the population used public transport.
- Three-fourths (¾) = 75%
Three-fourths of the participants supported the proposal.
Multiplication / Change
- Twofold = twice / 2 times
The figure increased twofold from 10 to 20.
- Threefold = three times
The number increased threefold from 10 to 30.
Proportions
- 2% = A tiny fraction
- 25% = Exactly a quarter
- 50% = Half proportion
- 75% = Exactly 3 quarter
- 78% = Over 3 quarter
- 81% = A significant portion
- 95% = A very large proportion
14. PTE Describe Image Collocations
| Verb + Adverb | Adjective + Noun |
| increased significantly | a dramatic increase |
| dipped sharply | a slight fluctuation |
| fell rapidly | a sudden rise |
| dropped dramatically | a rapid growth |
| fluctuated slightly | a gradual decrease |
15. Sentence Verbs for PTE Describe Image
⏮️ Past
Use past simple when the chart gives completed years.
- The USA recorded the highest figure in 2010.
- The period witnessed a significant increase between 2000 and 2010.
- Japan experienced a sharp decline in sales in 2015.
- The country consumed 50 million tonnes of oil in 2010.
- Canada had the highest number of visitors in 2005.
- The figure was 45% in 2010.
- Online sales accounted for 30% of total sales in 2015.
- The company owned 500 vehicles in 2010.
📍 Present
Use present simple when describing a current situation or a chart with present data.
- The USA records the highest figure.
- The period witnesses a steady increase.
- The country experiences significant growth.
- Japan consumes the most energy.
- Canada has the highest percentage.
- The figure is 45%.
- Online sales account for 30% of total sales.
- The company owns 500 vehicles.
🔮 Future
For predictions/projections, use will + verb or is expected to + verb.
- The USA will record the highest figure in 2030.
- The period will witness a significant increase.
- The country will experience rapid growth.
- Japan will consume more energy in the future.
- Canada will have the highest percentage.
- The figure will be approximately 60%.
- Online sales will account for 40% of total sales.
- The company will own more vehicles.
16. ⭐ Simple PTE Describe Image Structure
The following PTE Describe Image Vocabulary can be combined with a simple structure to create a fluent and organised response. Focus on the main trend, important figures, comparisons, and overall information rather than describing every detail.
Introduction: Paraphrase the question.
Example The table compares ___________________________.
Example: The line graph illustrates ________________________.
Body 1: Describe about: Increase/ Highest/ Largest/ Vertical or Horizontal/ Level/ Foreground/ Male/ Peak/ Oscillation.
Body 2: Describe about: Decrease/ Lowest/ Smallest/Category/ Section/ Background/ Female/ Bottom/ Fluctuation.
Conclusion: Overall, the table/ image/ graph provides useful information about _________________.
5 thoughts on “PTE Describe Image Vocabulary: Graph Words, Trends & Examples”